It was in mid autumn when I heard there will be a local version of the Chaos Computer Congress, the annual conference of the German hacker association Chaos Computer Club, called Datenspuren in the city of Dresden. Since I was living in Dresden back then, my attendance was somewhat mandatory. But when I check the program one day in advance I saw something even better: There would be a hackathon organized by the city of Dresden and they would award prices worth of 7000€ in total. Even better: The topic was about handling data!
So, I quit work early that Friday and headed over to the office of ol’ Justus, who was in immediately. The goal of the hackathon was as follows.
The city of Dresden has a number of infrastructural, election, and general statistical data. But they do not really know how to use it. Sure, they do have a web page where you can have a look at the data. But this is it. Back then there was no API to access the raw data or whatsoever. Some people in the city council might have thought: “Why don’t we hand a big portion of the data to the nerds and look what they would do with it.”
In its essence the data provided by the city was the underlying files of the so-called Themenstadtplan, the interactive map of the city of Dresden to display information. Since they were made available beforehand, Justus and me took a deep dive into it to come up with a catchy idea. And we did.
Which part of town fits me best?
This is a question asked especially by young students, who are about to start their studies at the local university. You have never been to the city but yet you have to search for a place to live at.
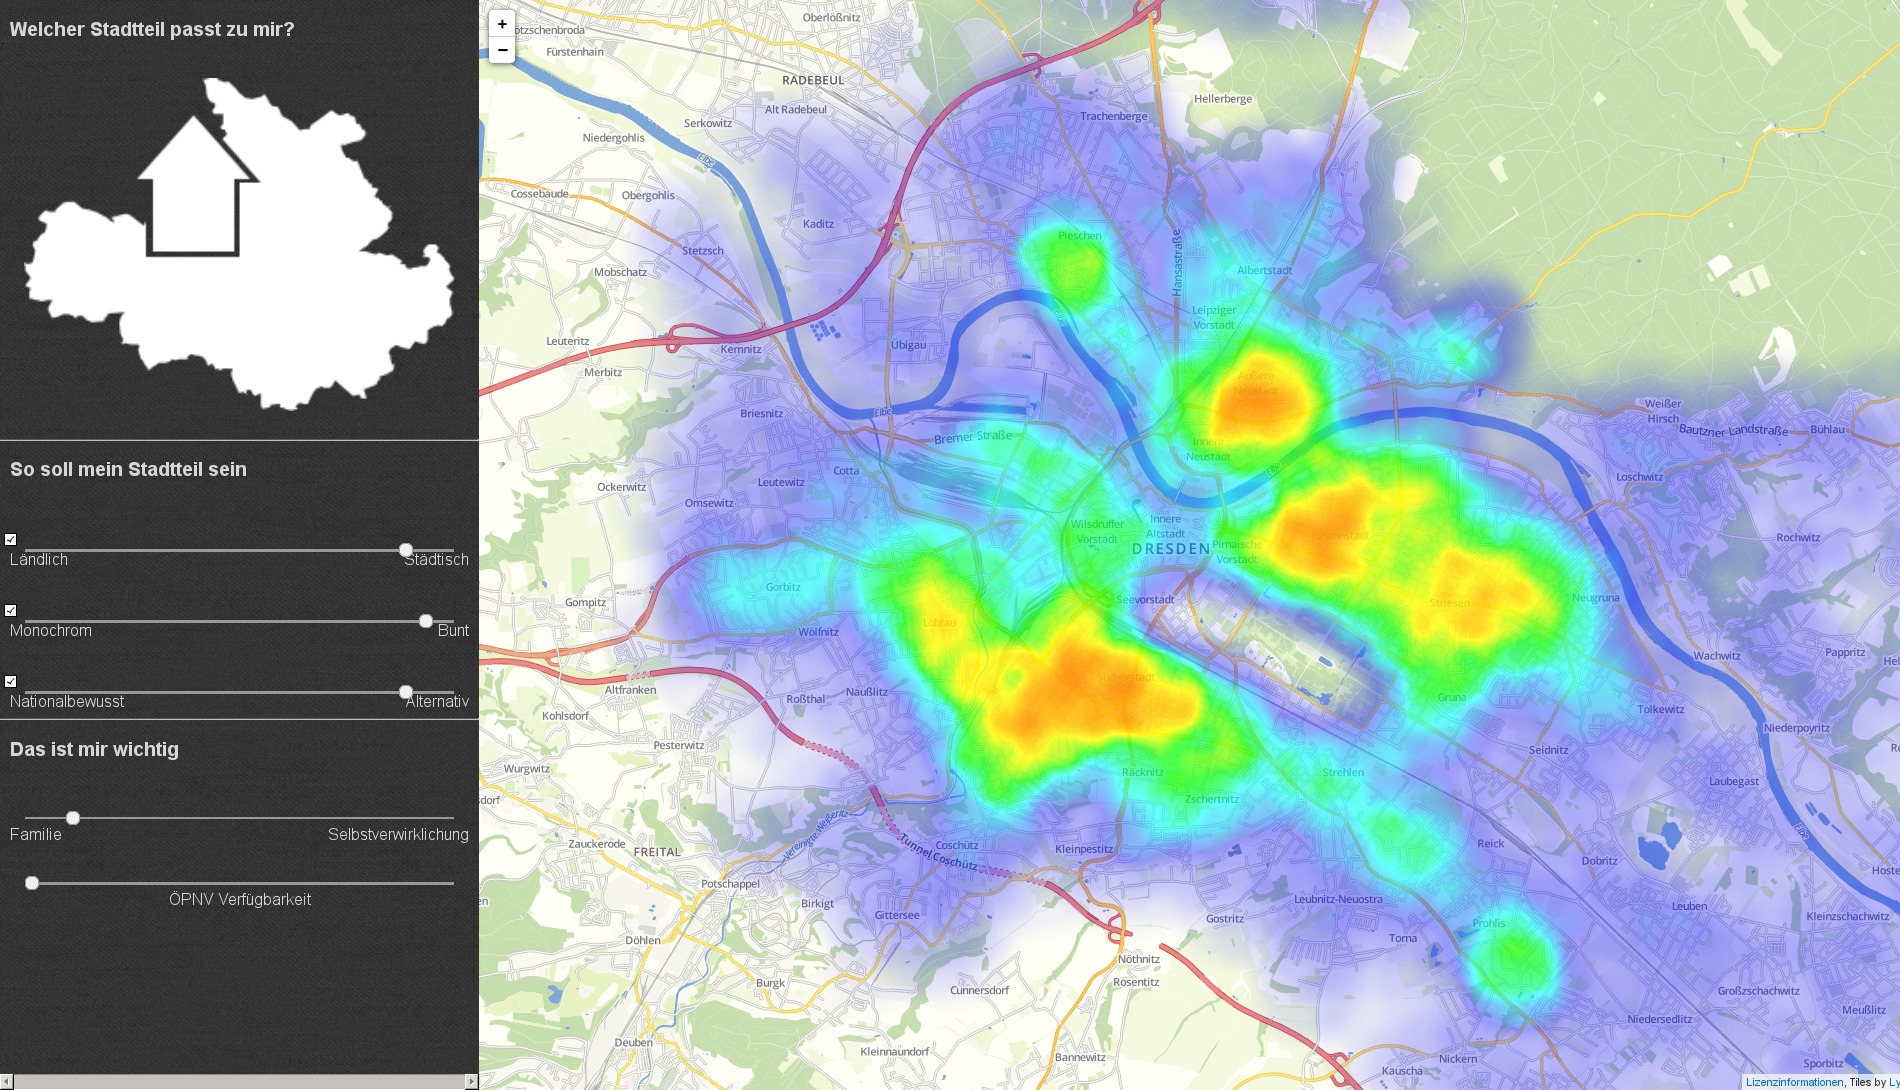
In our project we want to condense most of the data of the city into 3-5 plausible variables, which can be used to describe the overall lifestyle and atmosphere in a district and are independent of each other. The choice of the user should be displayed as a heatmap on Openstreetmap tiles showing Dresden and she should be able to alter her choice of the variables interactively using some sliders. Since I had some experience in creating such interactive widgets from writing my climex app, we were convinced to pull it off in just one day. Unfortunately this is all the time you have at a hackathon.
Next day around 15:00 we started the project. Fortunately Stephan, a very talented college, joined too and he brought another person capable of programming some JavaScript. Some hours later, at 00:45, we had two working versions of the application! A JavaScript-based Leaflet application and a R-based fallback solution written by me. It consumed a lot of strength but it was one of the most adventurous weekends I had in Dresden.
We decided to let the user specify five different input variables.
- “Ländlich vs. städtisch” (rural vs. urban) - which is calculated using the density of the population
- “Monochrom vs. bunt” (monochrome vs. colorful) - whether there are lots of persons of color in the district or not
- “Nationalbewusst vs. alternativ” (patriotic vs. alternative) - calculated via election results
- “Familie vs. Selbstverwirklichung” (family vs. self-fulfillment) - this variable is computed from the weighted densities of different sites like playgrounds, pubs, fitness studios etc. in the region (calculated via a point in polygon method using the borders of the districts and Openstreetmap data)
- “ÖPNV Verfügbarkeit” (access to the public transportation) - number of bus and tram stops in a district
The first three variables are dimensions for which the user has the choice to incorporate them or not. Variable 4 and 5 will always be present and weight the resulting density obtained by the first three.
In case you are wondering about variable 2 and 3: Dresden, the capital of the state of Sachsen, is so damn right-winged and conservative it actually hurts. No one should have to live next to a fascist!
Result
In the end we won one of the main prices and the price for the best visualization! Only team with to awards FTW!
You can find the awesome talk of Stephan presenting the project on YouTube.
By now you must be pretty excited about trying the application. Fortunately there is Github Pages to host static web pages. So try it.